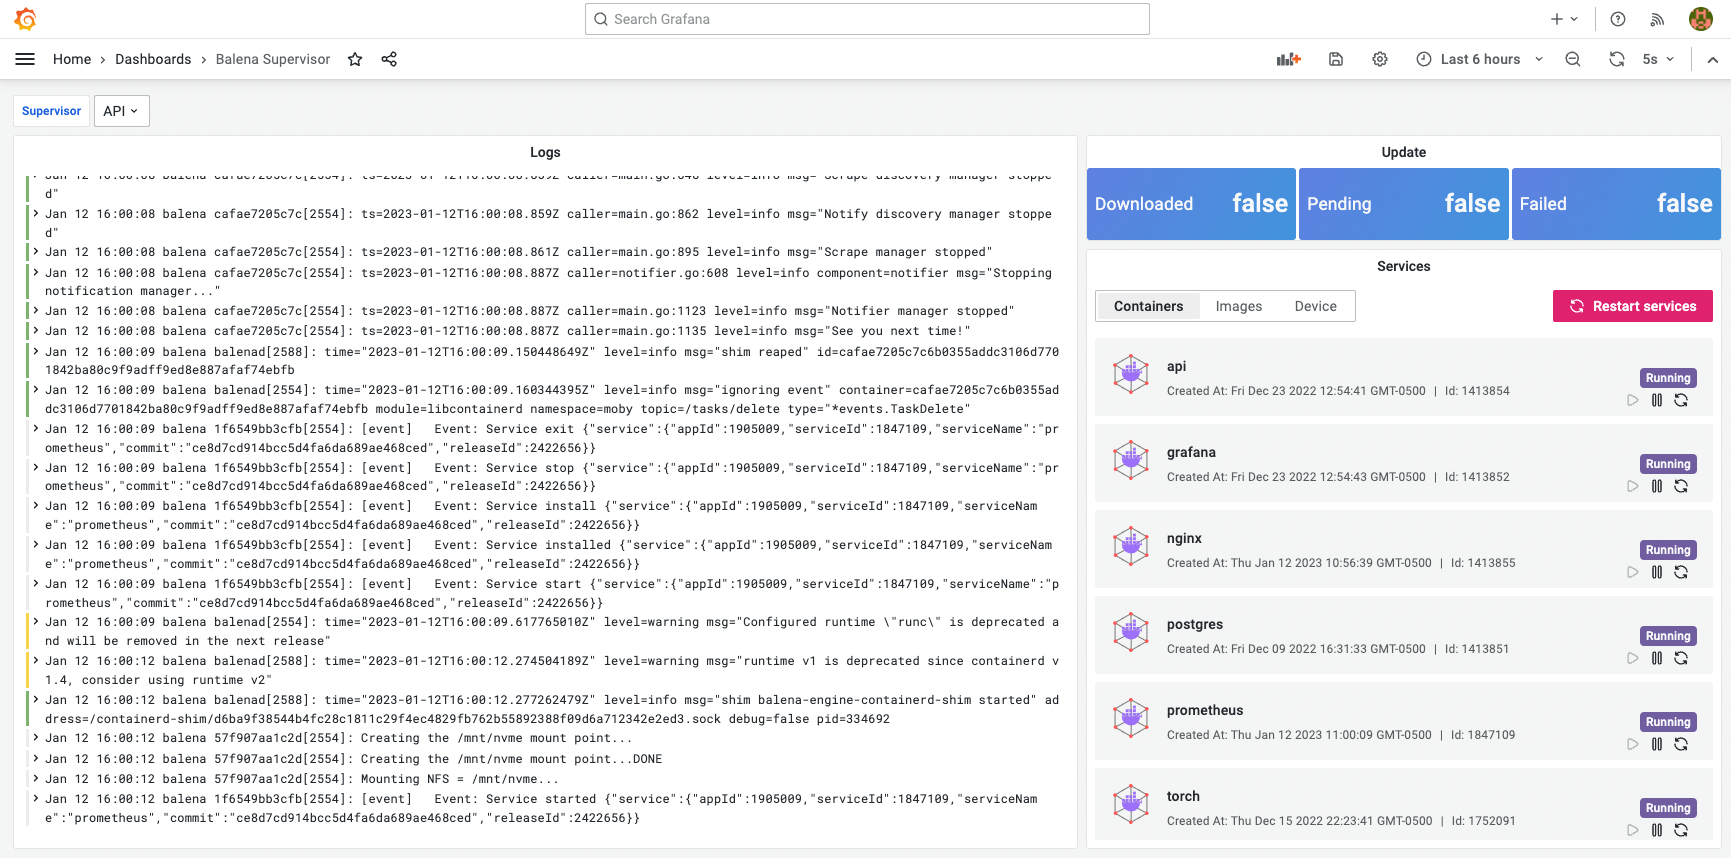
The Balena Application plugin for Grafana allows to display device information and manage services using Balena Supervisor API.
Working in a productive alliance, Balena, Grafana, and the Balena Application plugin simplify managing a network of non-homogenous IoT devices. If needed, a device could be made accessible directly, which means internet access is not required.
- Grafana 9.0+ is required.
The Balena Application is not included in the Grafana Catalog. It can be installed manually from our Private Repository or downloaded directly from the GitHub repository:
grafana-cli --repo https://volkovlabs.io/plugins plugins install volkovlabs-balena-appOur custom Grafana build with the Balena Application plugin can be deployed directly to balenaCloud:
- Allows to display device, release information, and service logs using Balena Supervisor API.
- Provides Services Panel to start, stop, and restart Containers.
- Allows to filter Logs using a Regex pattern.
- Requires Confirmation to restart all Services and reboot the device.
- Environment Variables sanitized from Target State.
| Section | Description |
|---|---|
| balenaCloud | Explains how to use balena Application in balenaCloud. |
| Provisioning | Demonstrates how to automatically provision balenaSupervisor Data Source. |
We love to hear from you. There are various ways to get in touch with us:
- Ask a question, request a new feature, and file a bug with GitHub issues.
- Sponsor our open-source plugins for Grafana with GitHub Sponsor.
- Star the repository to show your support.
- Apache License Version 2.0, see LICENSE.


